
Layers could be defined as view filters applied to graphs.
They allow to visualize the graphs under different aspects, different dimensions, etc…
Apply a layer on a graph #
Graph creators can propose layers on each of their graphs to the Linkfacts community.
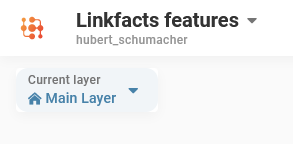
To see if the creator of a graph has proposed one or more layers, click on “Current Layer” at the top left of any graph.
Then click on the layer you want to see.
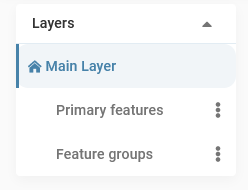
For example, on this graph showing Linkfacts features, its creator has provided two layers, that we could assimilate to two different pre-defined views:
- One showing only the primary features of Linkfacts,
- And another showing only the feature groups of the tool.
Create a layer #
You can of course create your own layers on your graphs, wether they are public or private.
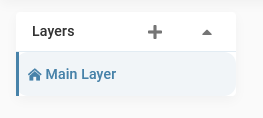
Click on “Layers” on the top left corner of your graph, and on the “+” button.
Rename it if you want by clicking on “More” and “Rename”.
You’ve created a new layer !
Filters #
To edit a layer, select first the layer you want to modify.
Then, you’ll have to go to the “Filters” section of your graph, in the bottom toolbar of Linkfacts.

Then select the visual changes you want to apply to the nodes and/or links on your layer.
For a node type, click on “More”, then click on the option of your choice. Same manipulation for a link type.
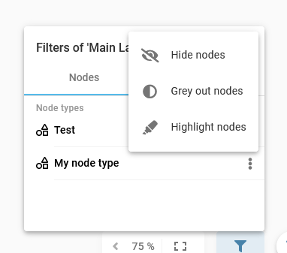
You now have several possibilities:
- Hide a node or link type from a certain type,
- Change the color of nodes or links from a certain type,
- Highlight nodes or links from a certain type.
Click on what you desire and see what’s changed in your graph view.
Layers have no influence on your nodes and links ! They are only a predefined view that can be changed at any time.
To return to the original view of your graph, select “Main layer”.


