If you operate you own website, you can embed LinkFacts graphs, mind maps, text tiles and tables directly into your website.
Knowledge graphs in LinkFacts
Inside LinkFacts knowledge is organized as graphs. A graph is a collection of nodes and connections between them. Each node and each connection can have its own visuals and carry data, files and attached links. A graph can be huge, but the visualization options of LinkFacts allow users to view those parts of the information they are interested in or that they want to share with others.
Share your public data with the world
Each graph can be shared as a whole, but also each specific view and perspective can be shared as well. The sharing can be done via social media like Facebook, Twitter, LinkedIn, but the option that is of interest here is the “Embed” sharing, allowing to embed what would be shared in your website or any other platform that supports IFRAMEs (a specific HTML tag for this purpose) like for instance MIRO.
Get the embedding code snippet
Perform the following steps, that require that you have an Advanced/Team/Organization LinkFacts account. For this example we will take the public graph of the overview of the features of LinkFacts – Here is the link
Upgrade your account to ‘Advanced’ if necessary
Login to LinkFacts (button on this page)
Open the public graphs that you want to share. This only works for public graphs that anybody can visit
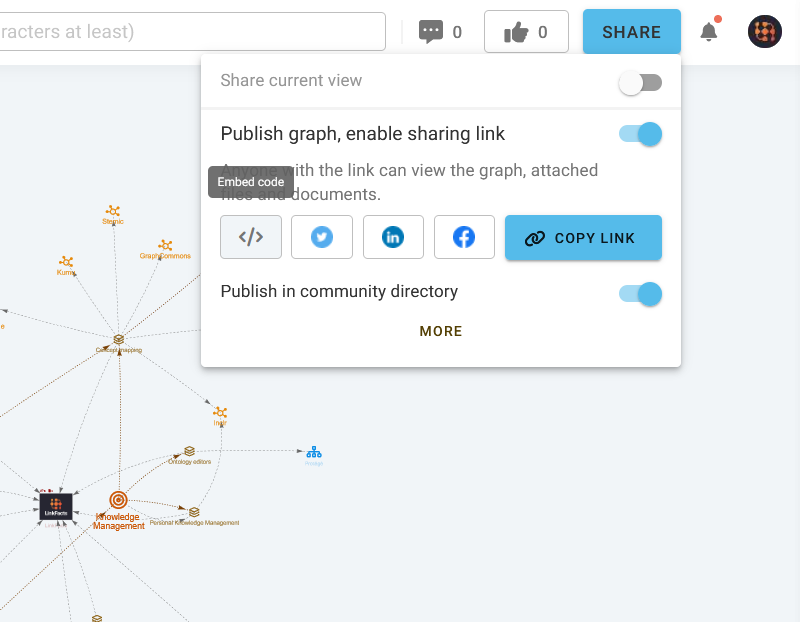
Click on ‘Share’ and select ‘Embed’
Click on ‘Copy code’
Paste this code into the desired place in your website
The share menu, where you can access the ‘Embed code’
Same data – different views
Where LinkFacts shines is in it capacity to various visualization modes, but also the user interaction capabilities of embedded graphs. The following sections will illustrate the possibilities.
But to use them, one important setting needs to be discussed, namely the ‘Share current view’ switch at the top of the sharing dialog. If it is of, the whole graph will be shared in ‘Concept mode’. If switched on, the embed code will take care of embedding whatever is actually displayed. So you may play with the modes and the filters to have the desired results.
Example showing the graph with filter applied
LinkFacts comes with a powerful filtering system, allowing users to define which node types and connection types to render or to hide.
The ’embedding’ feature allows to only render such a filtered view.
Example showing a part of the graph in 'Mind mapping' mode
Each node in LinkFacts can be the root of a visualization as a mind map it form of a tree.
The ’embedding’ feature allows to exploit this feature and render for instance the following
Example showing the graph in 'Text Tile' mode
LinkFacts supports the visualization of graphs in ‘text tiles’..
The ’embedding’ feature allows also to render the different text modes available to the users
The settings explained
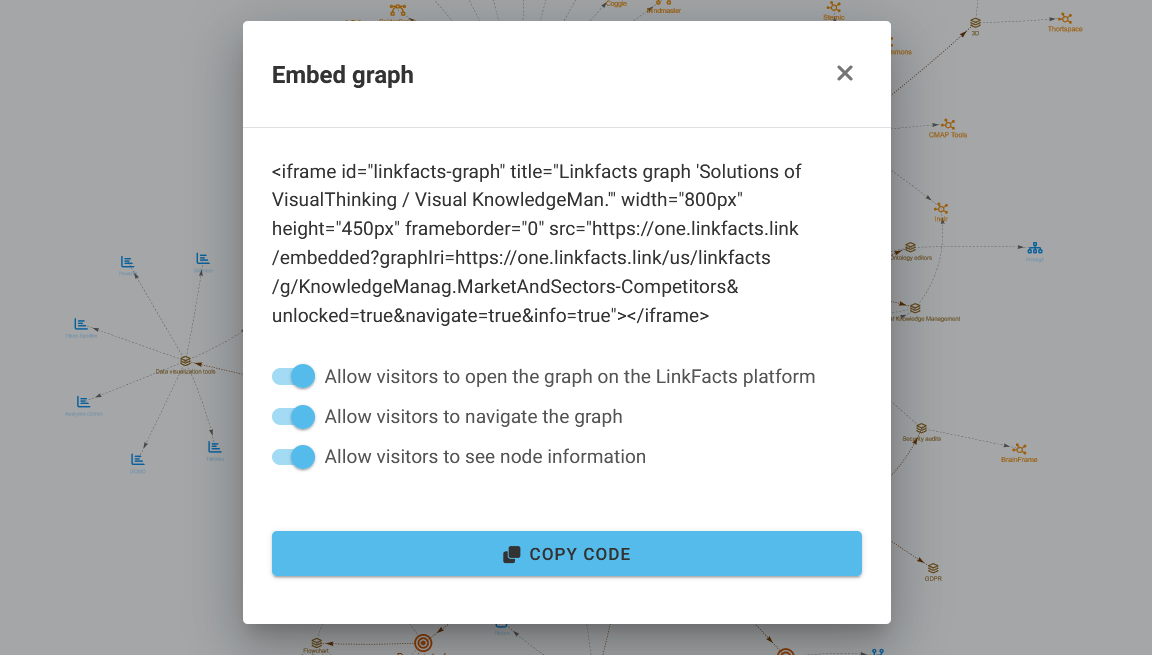
The code preview with a few option that are explained below.
‘Allow visitors to open the graph on the LinkFacts platform’: The graph you are embedding into your website has to be a public graph. As such it can be consulted an the LinkFacts platform and this setting defines if clicking on the LinkFacts logo should open the graph inside LinkFacts or not.
‘Allow visitors to navigate the graph’: The part you want to visualize can be interactive for the user and this setting allows you to control this. If enabled, clicks on the nodes will render the corresponding parts around the clicked node.
‘Allow visitors to see node information’: Each node in LinkFacts can have data (attributes), files and links attached. This setting allows you to define if you web visitor can access this information inside the rendered graph by clicking on the ‘I’.
A final word of caution: As the embed feature only works on ‘public’ graphs, the setting described above affect the user experience when interacting with the graph, but by no means reduce the visibility of data, as the visitor can visit those same graphs on the LinkFacts platform. For sharing information with specific users only, the graph has to be set to private and in the ‘Share’ menu, the link ‘more’ gives access to these functions.