
Spring 2022 new features
LinkFacts has released many new features in spring 2022. They all aim at empowering the user and improving the his experience and productivity when visually solving business problems, be it in the field of visual knowledge management, semantic mapping of risks, compliance, processes, best practices, business environments, shareholder structures.
The most notable new features and improvements are:
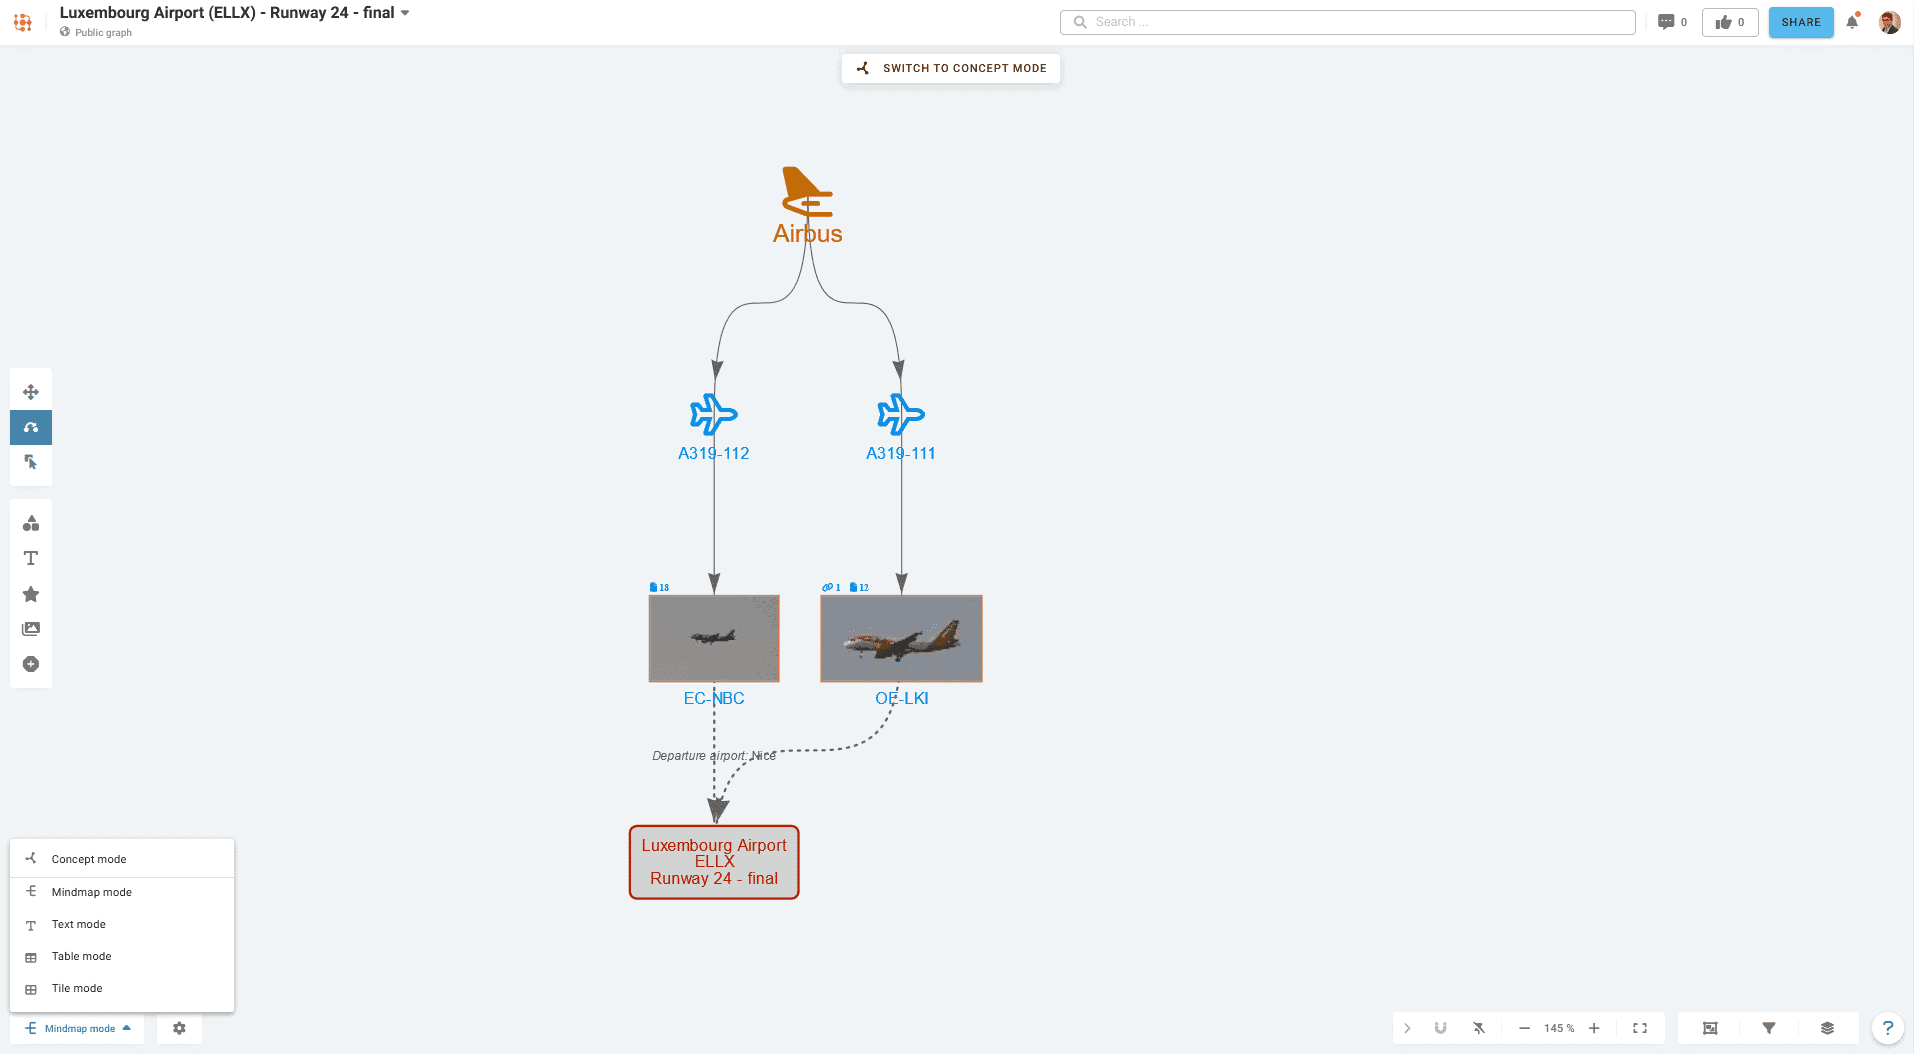
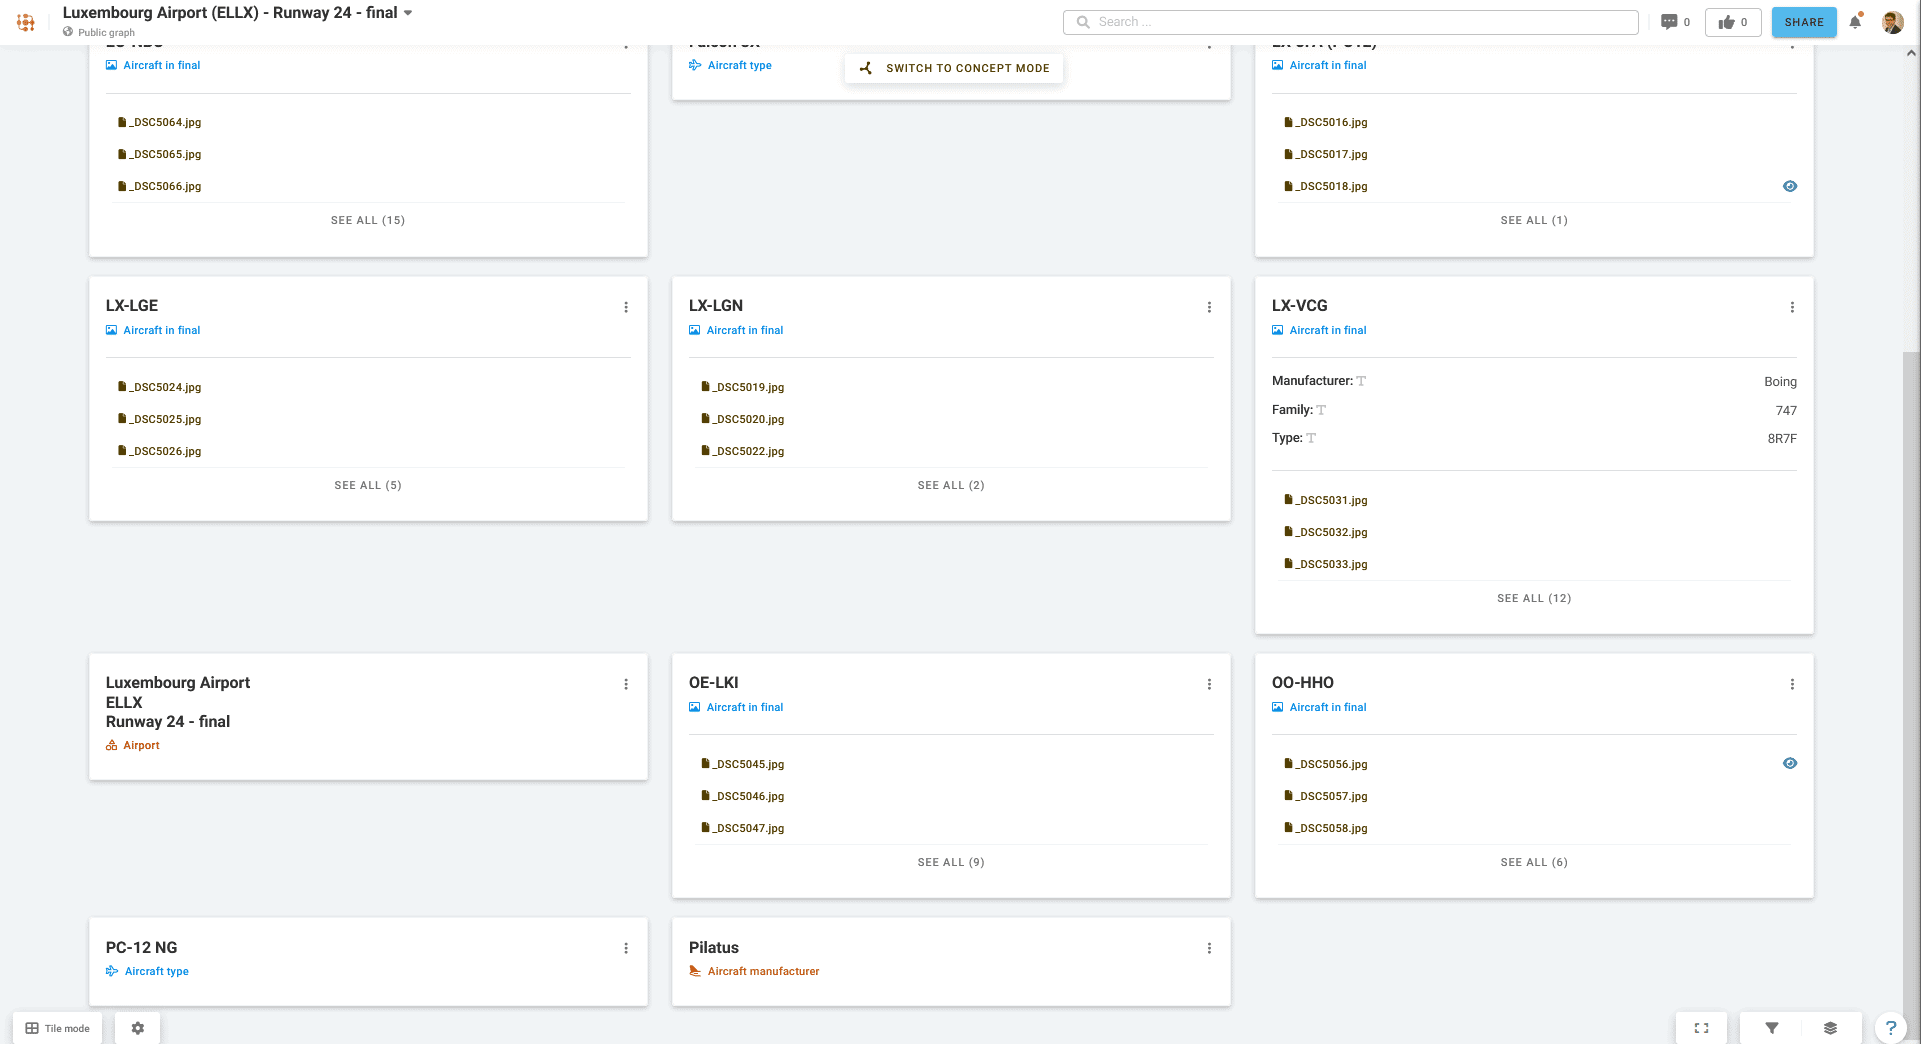
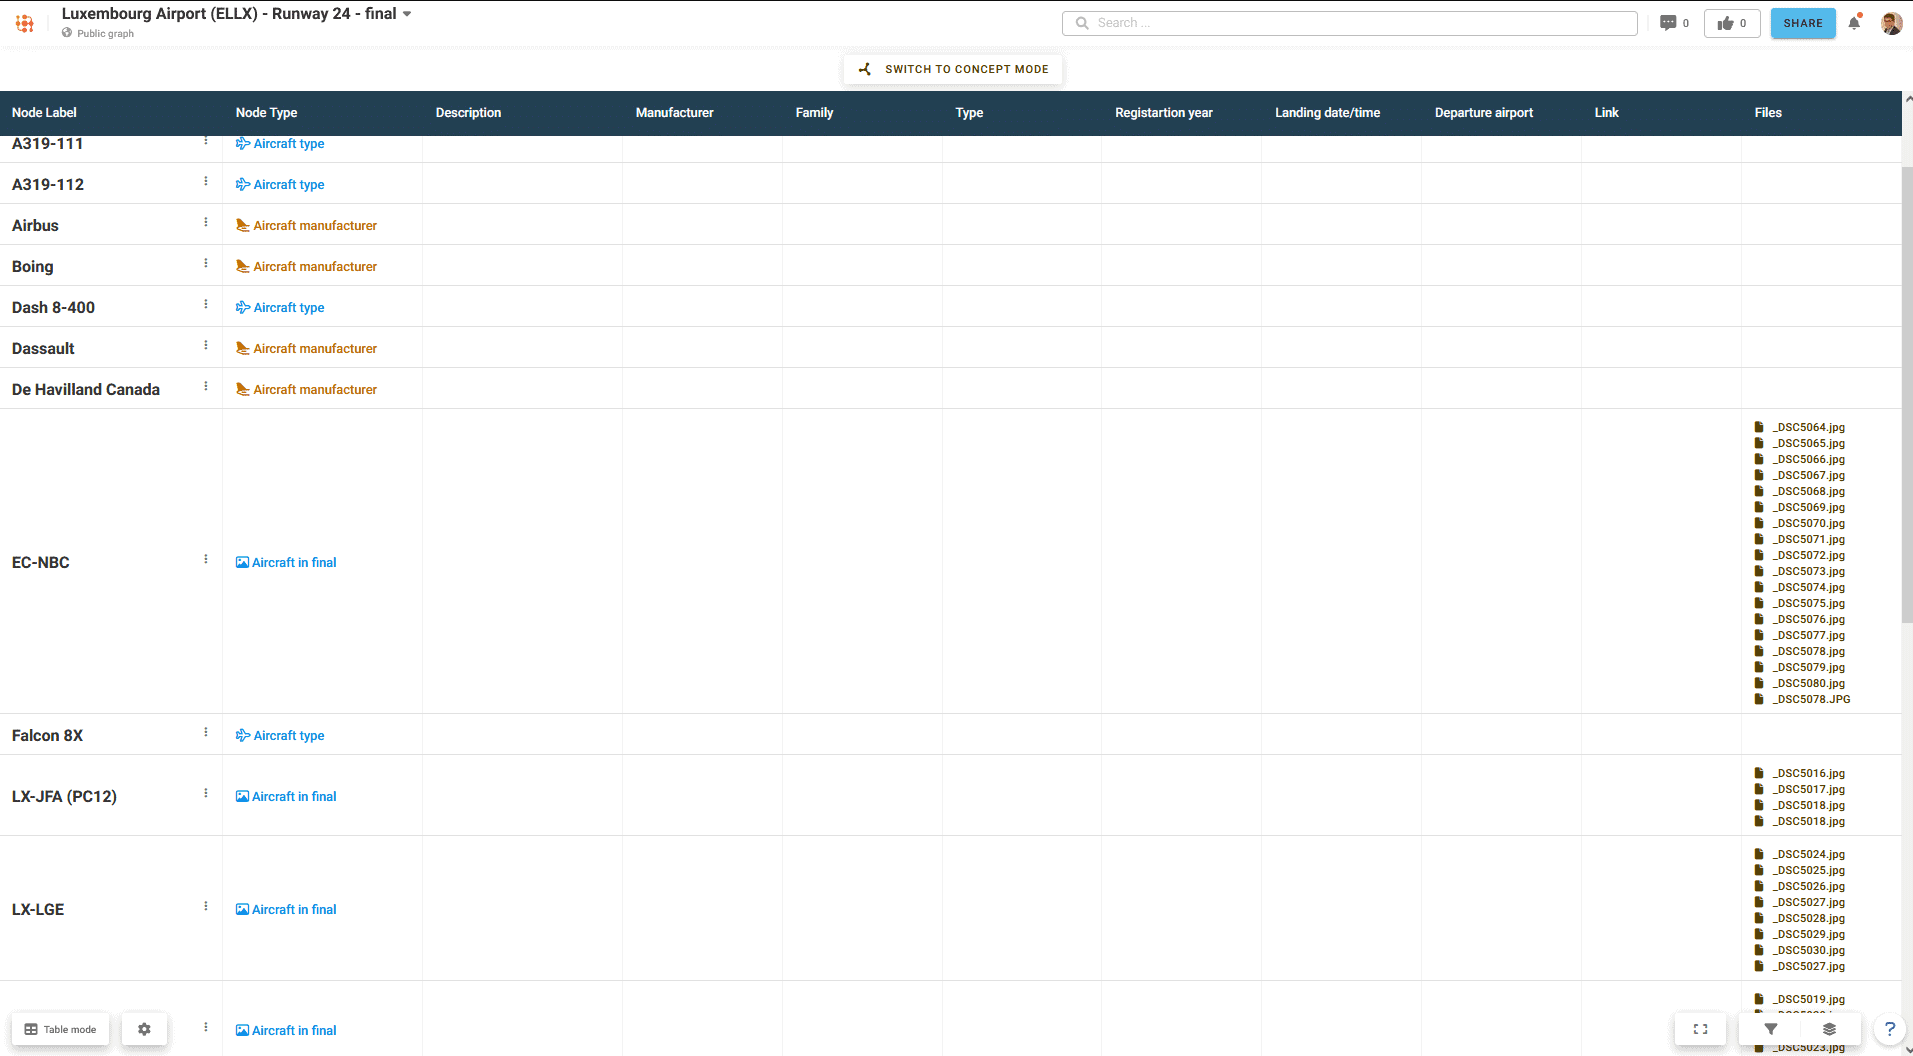
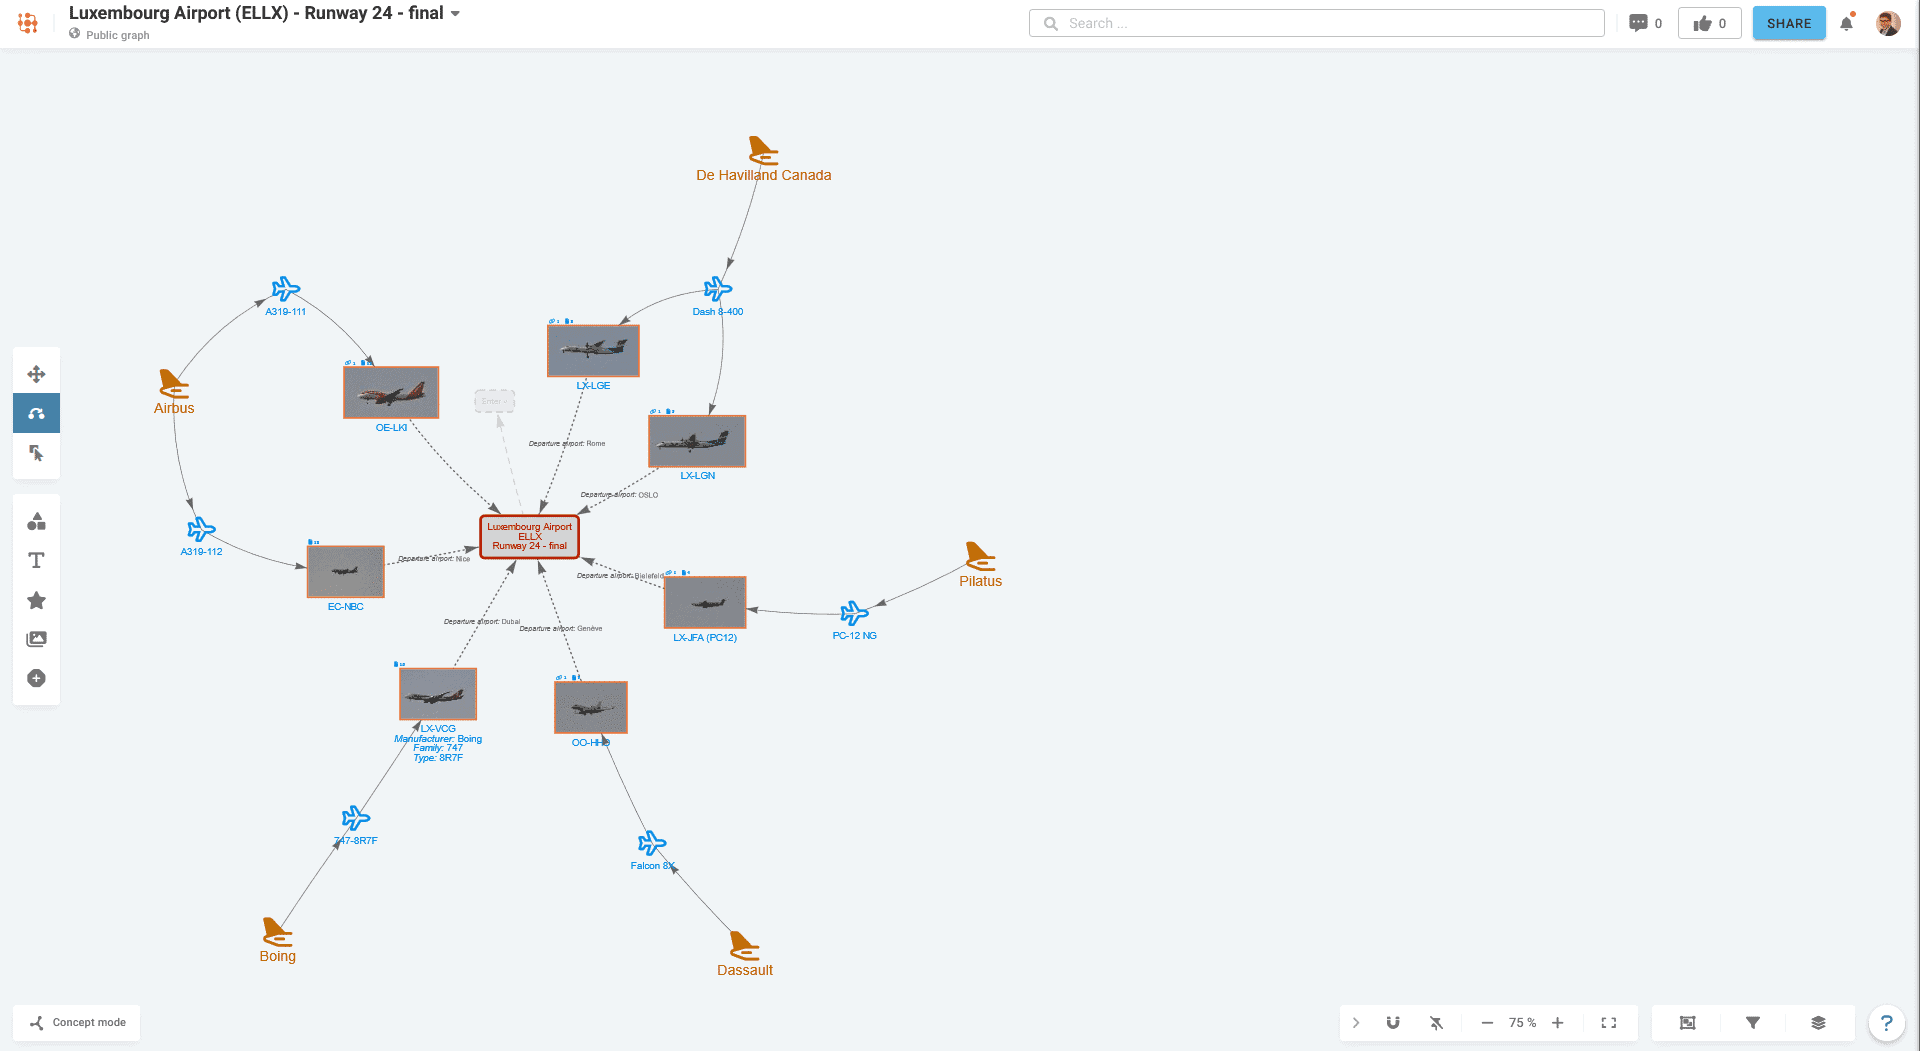
LinkFacts currently supports 5 different visualization modes:
The user can switch between them, but also edit data inline and select the appropriate mode when sharing or embedding LinkFacts data into own websites.
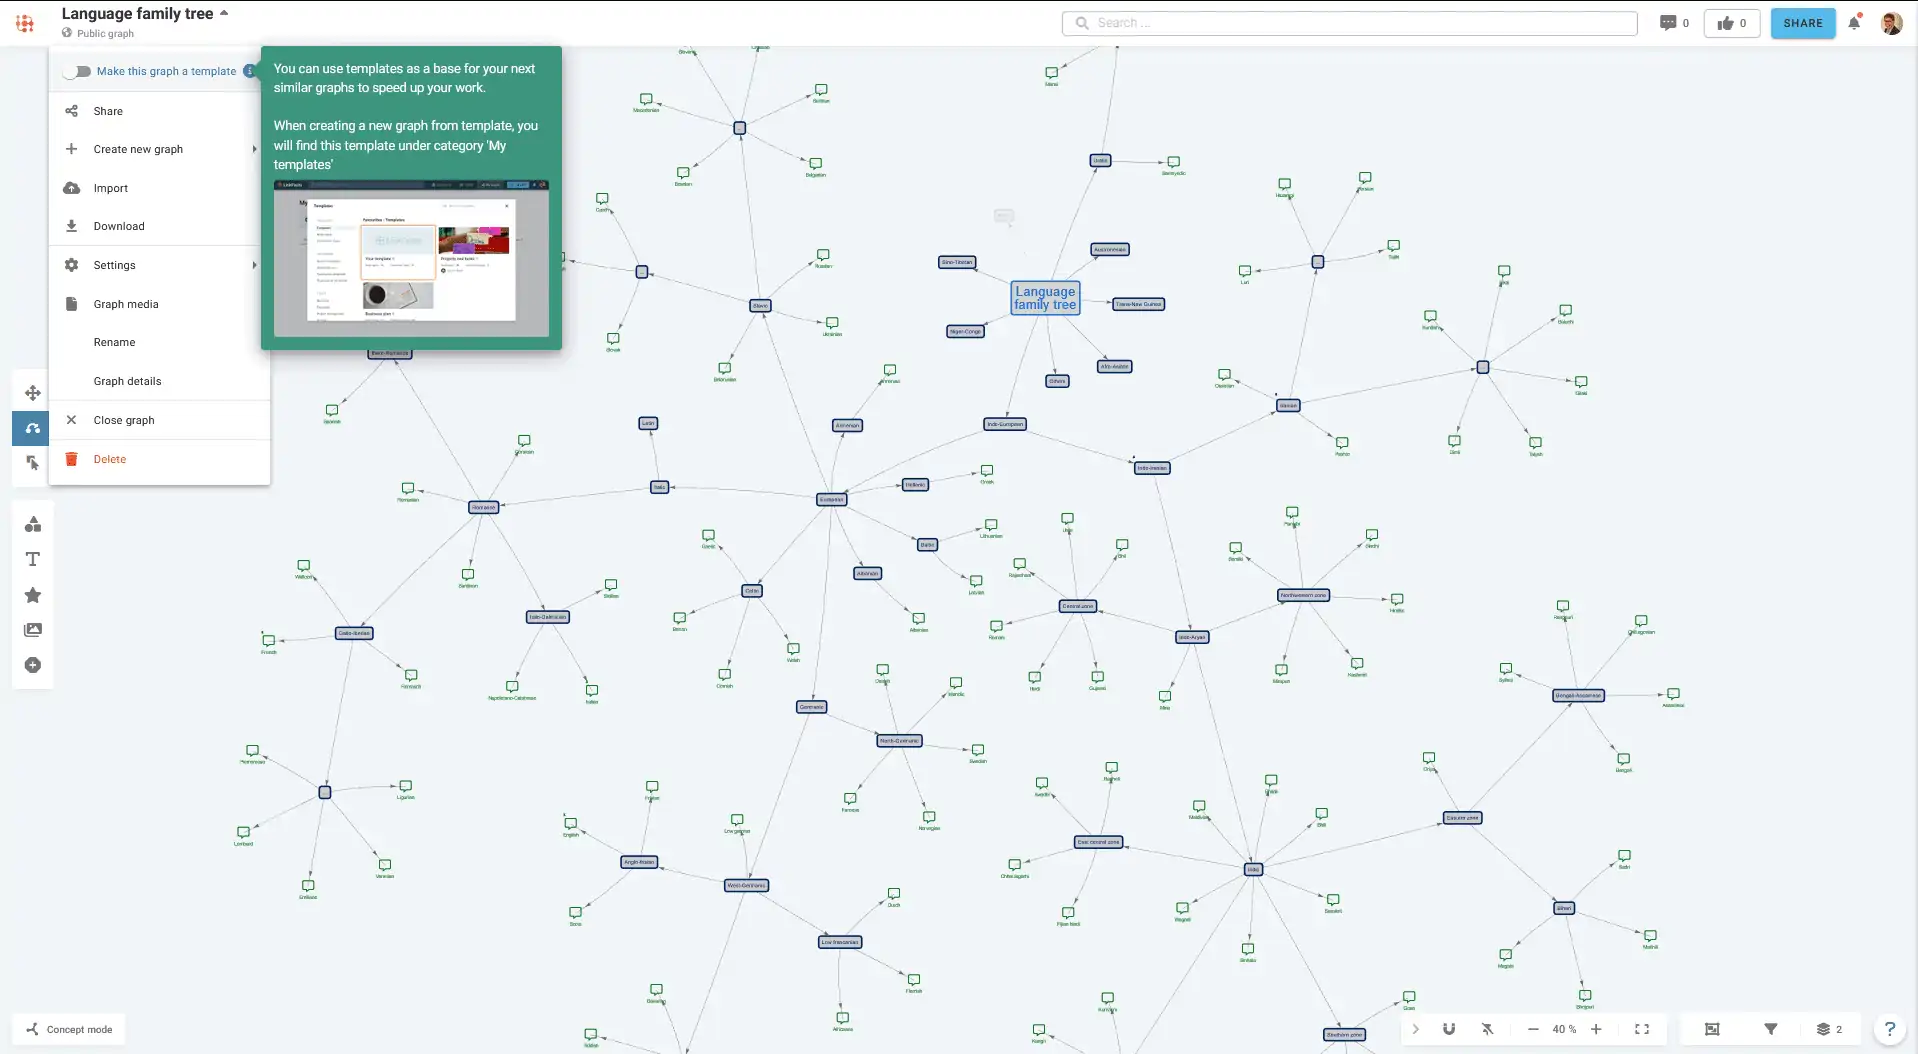
Any graph can be converted to a template for reuse of the node, connection and attribute types used in the graph. But fixed nodes and connections can also be part of the template. For instance you could create a template for business plans and in addition to predefined types, impose the nodes ‘Finances’, ‘Technology’, ‘Marketing’ and ‘Sales’ on each graph created from this template.
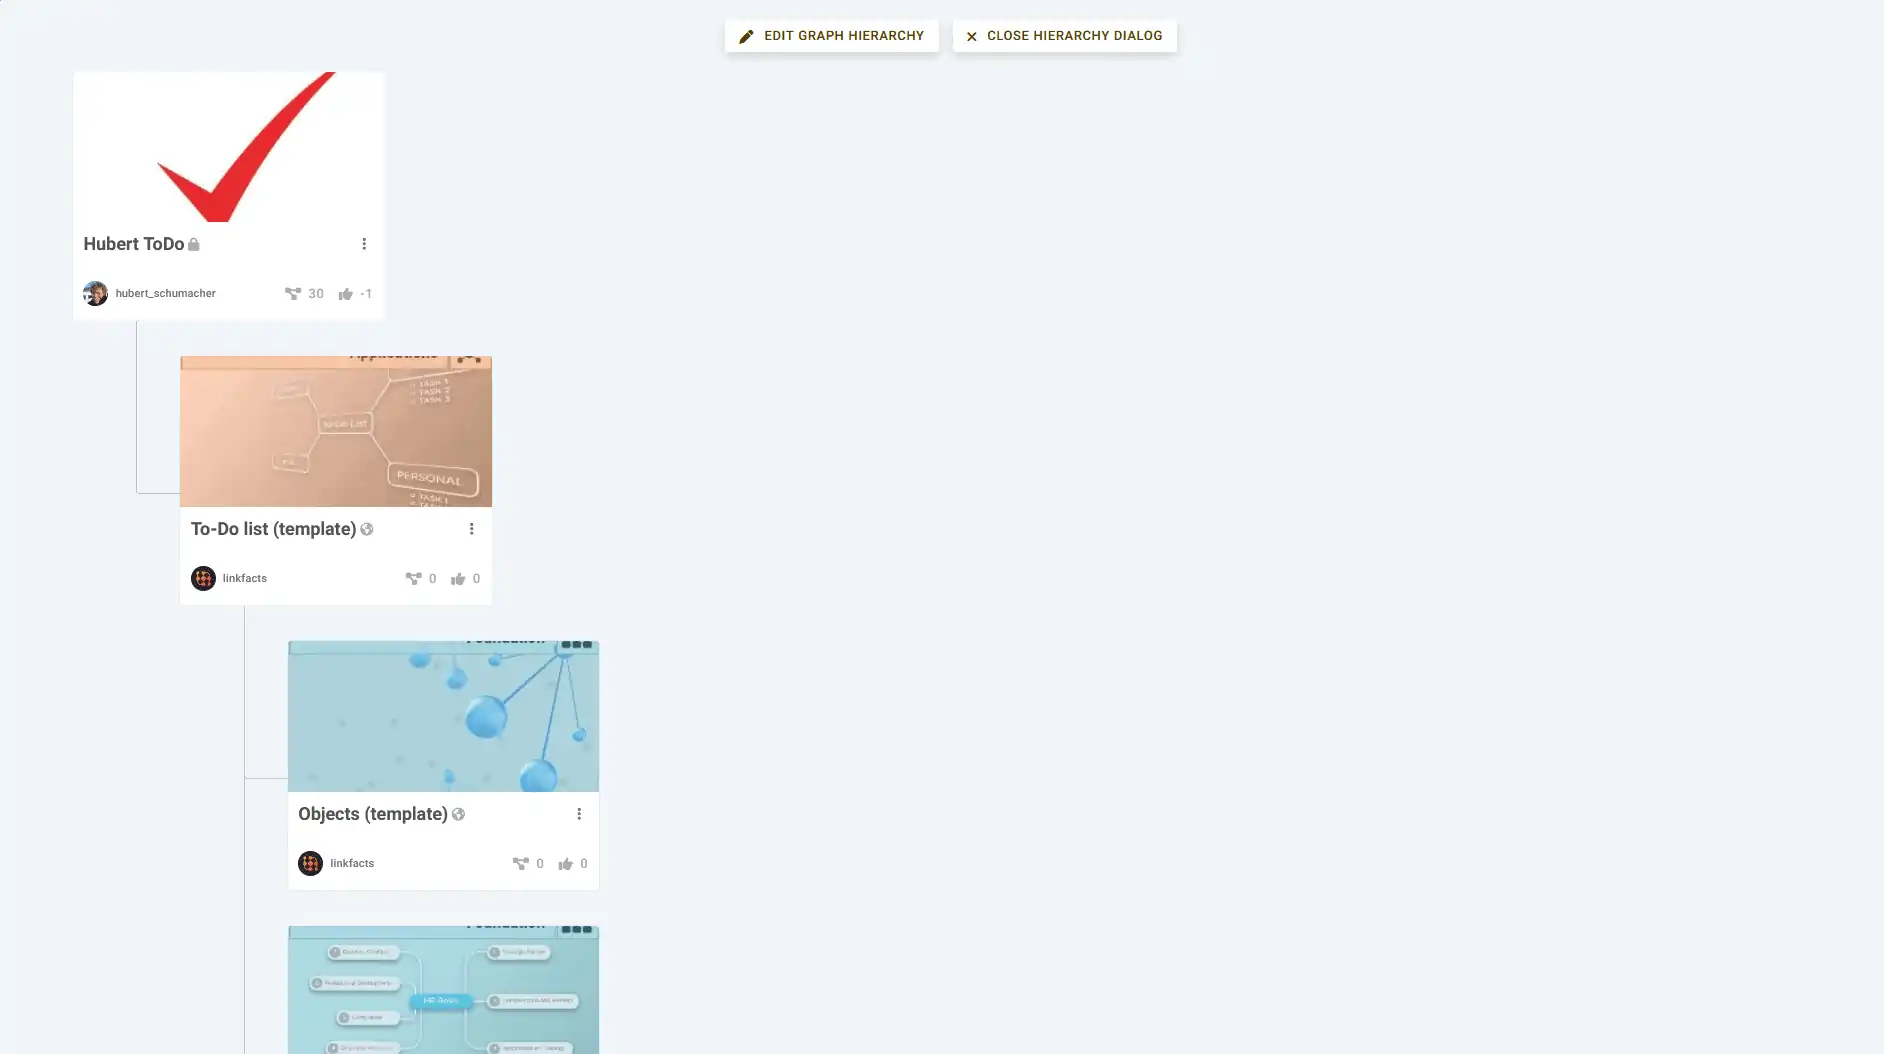
Graphs now can depend on each other. With that feature, it is easy for instance to have a high-level graph about some topic with the fundamental nodes and connections, and a low level graph with the details. Under graph settings > hierarchy the dependencies can be inspected managed.
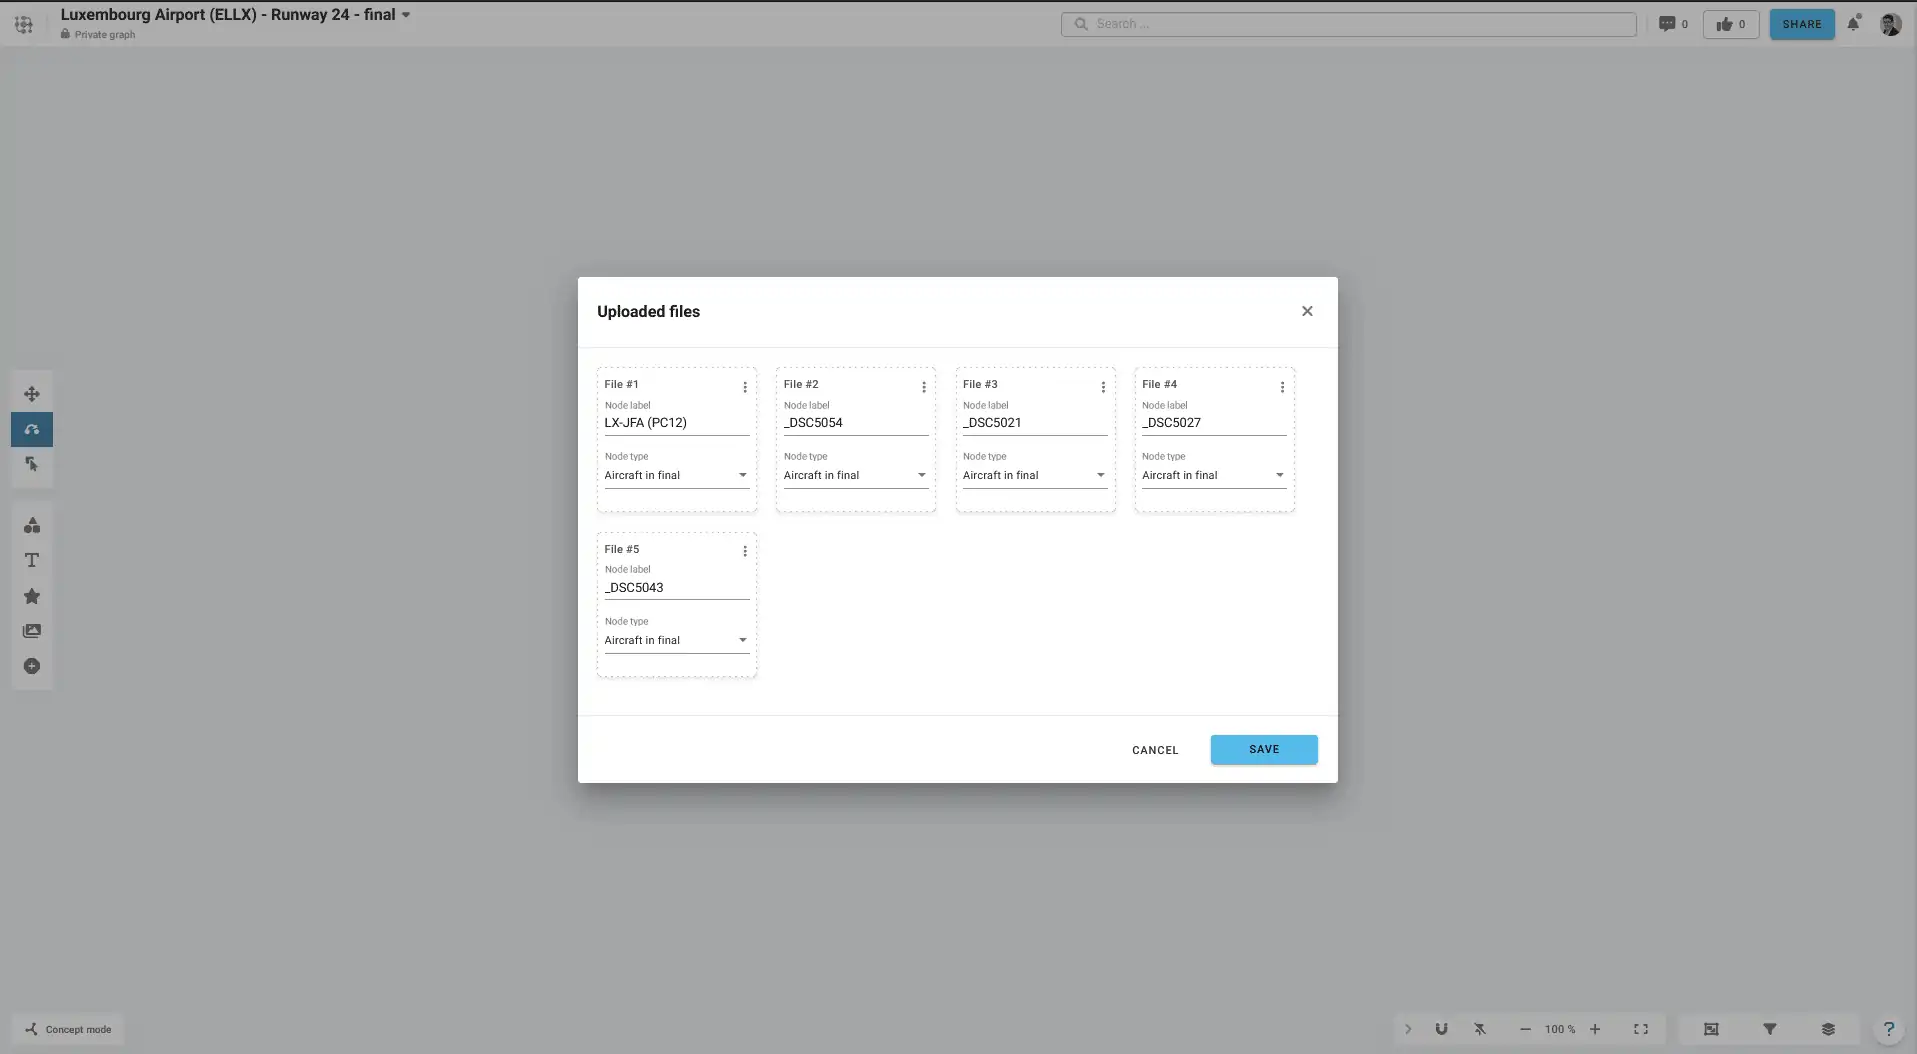
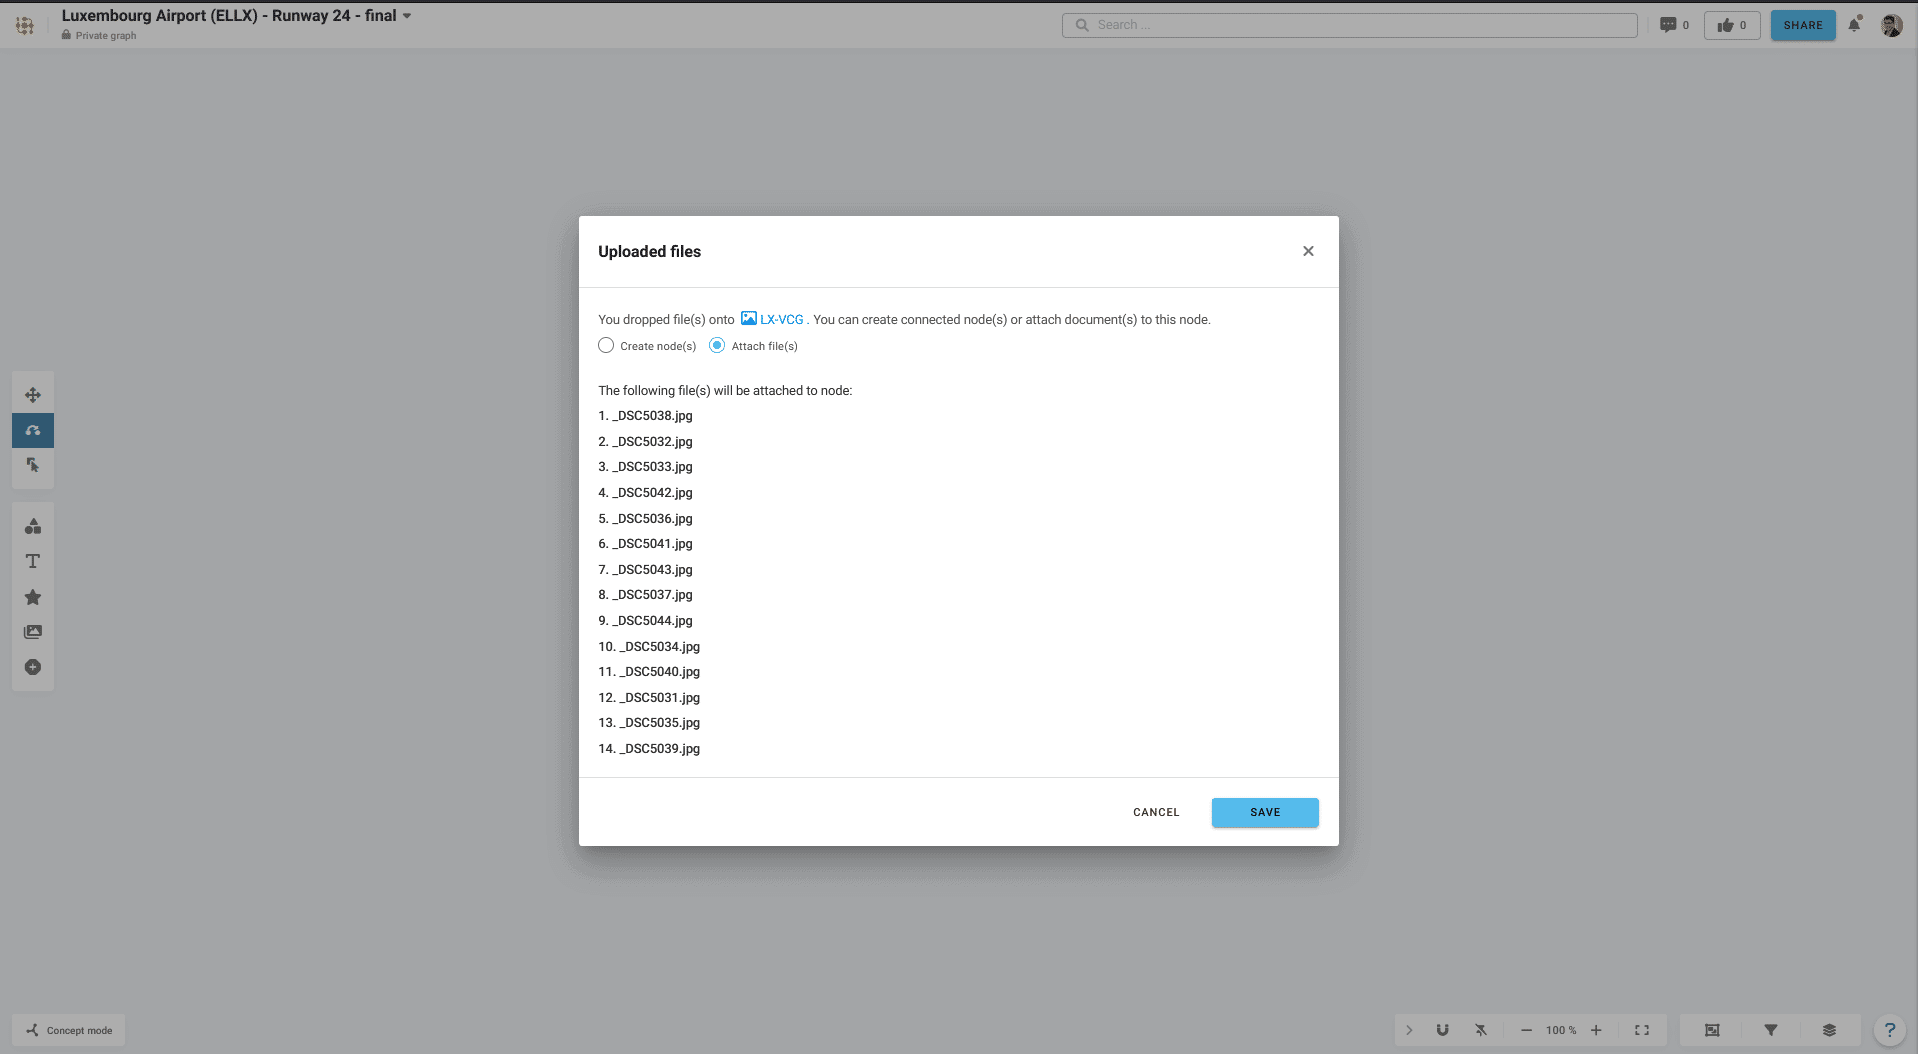
The user can now release dragged files or internet addresses onto a specific node of a graph and will have 2 options: attach the dropped elements to the target node or create new nodes, one per file or link that are connected to the target node. In this process the user can individually rename files and select the desired node types.
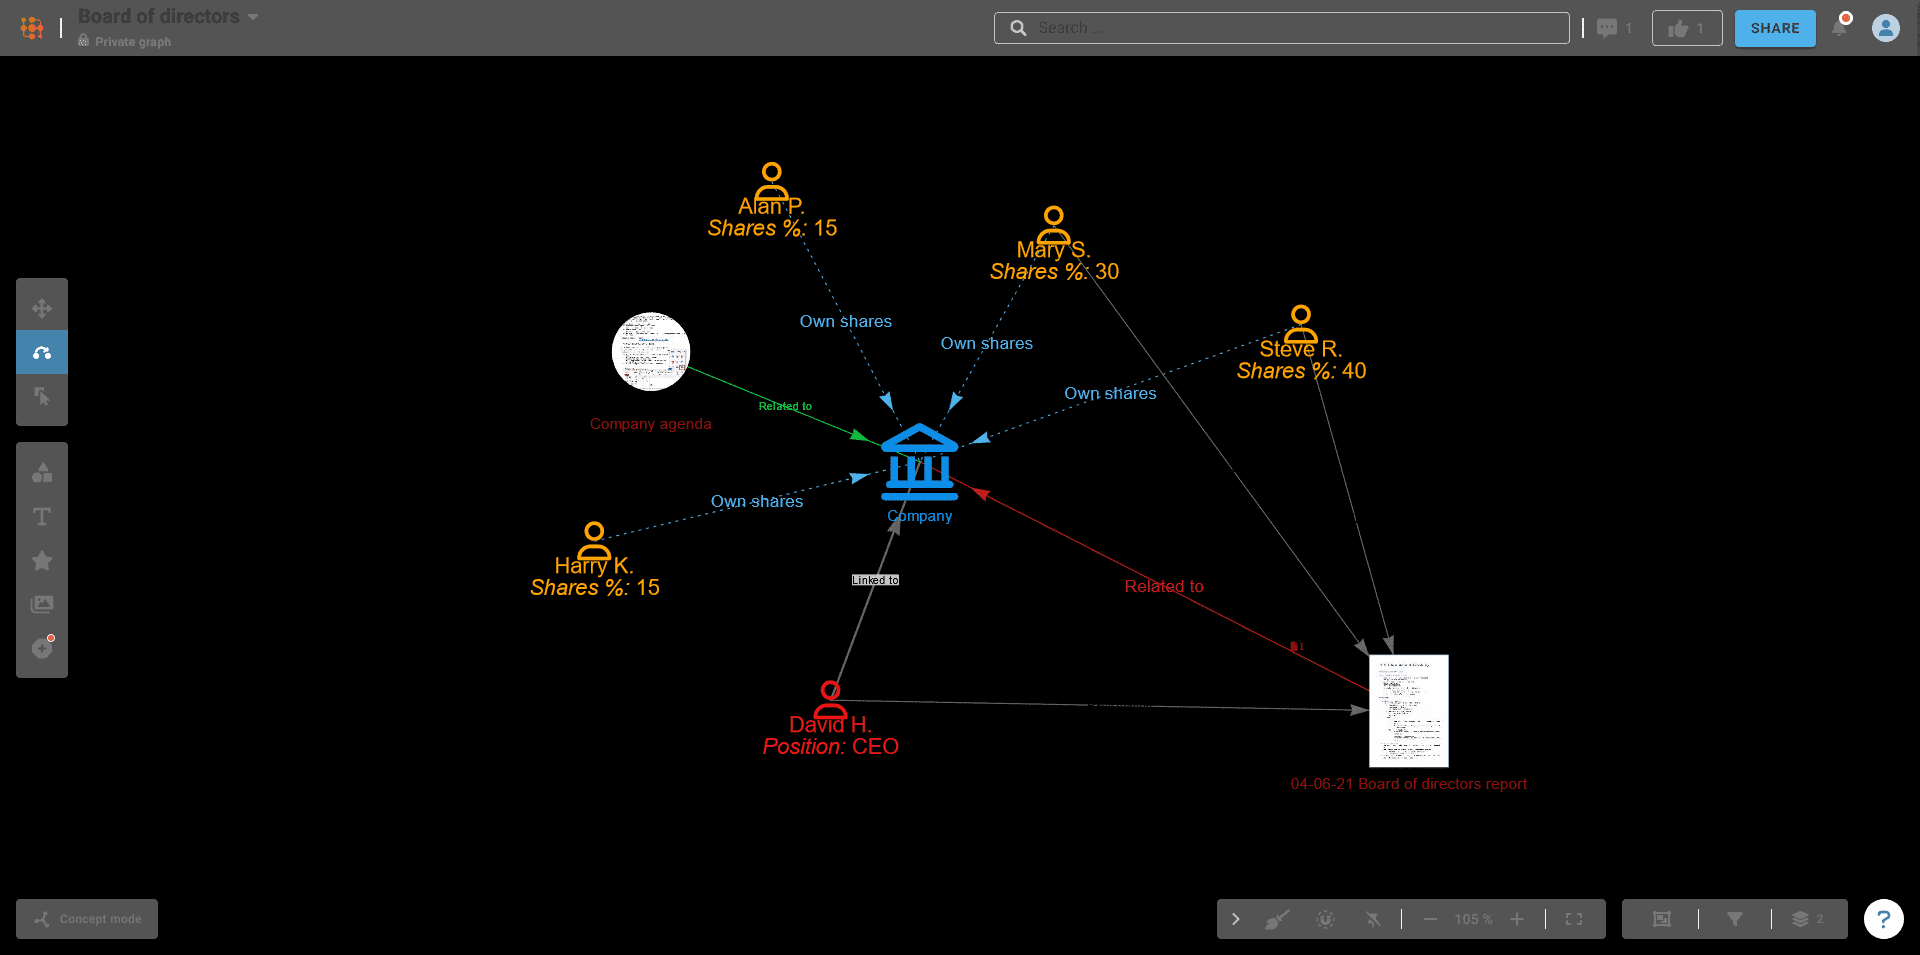
In the graph settings under layout menu, the background color of each graph can now be defined. See below that it might increase the readability of the semantic information contained in the graph.
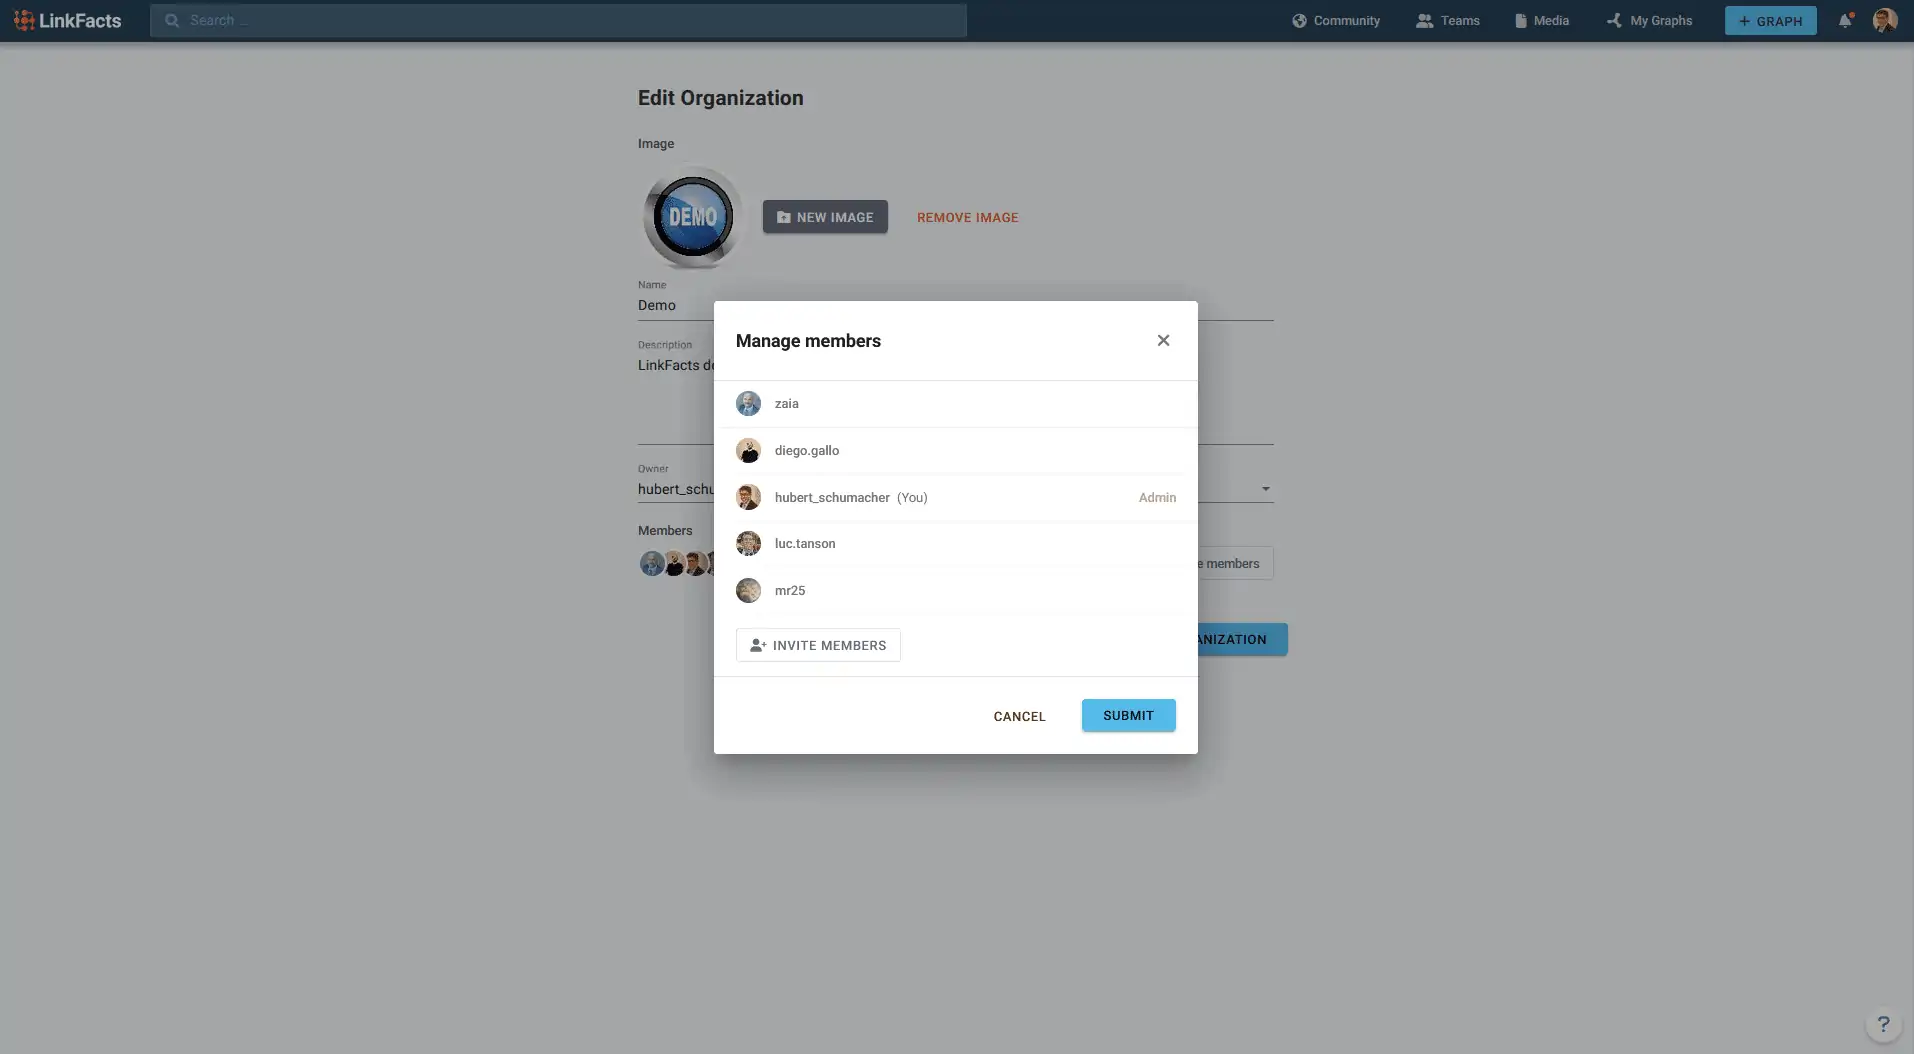
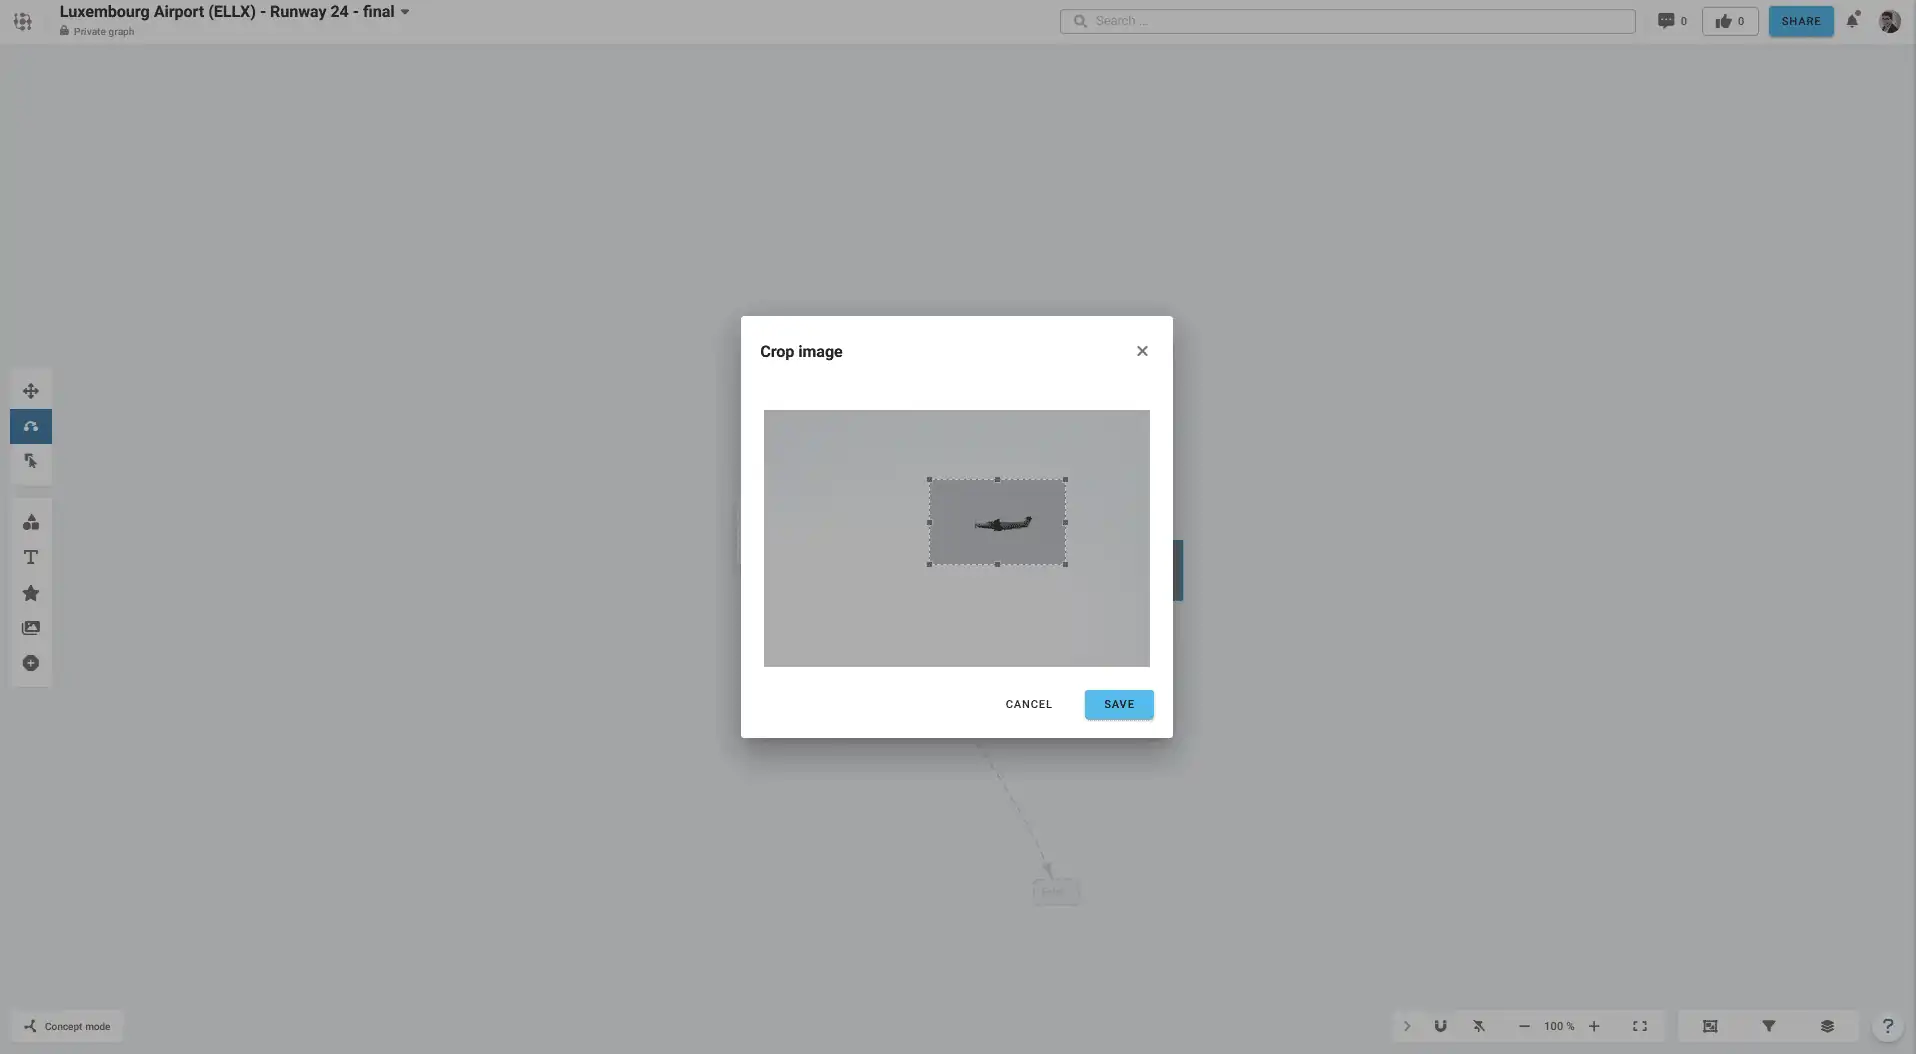
Each graph has a cover image which now can be zoomed, panned and cropped to select the most expressive region of the picture. The image itself is conserved in full size and resolution. The same feature is available for visualized nodes, profile pictures of users and teams.
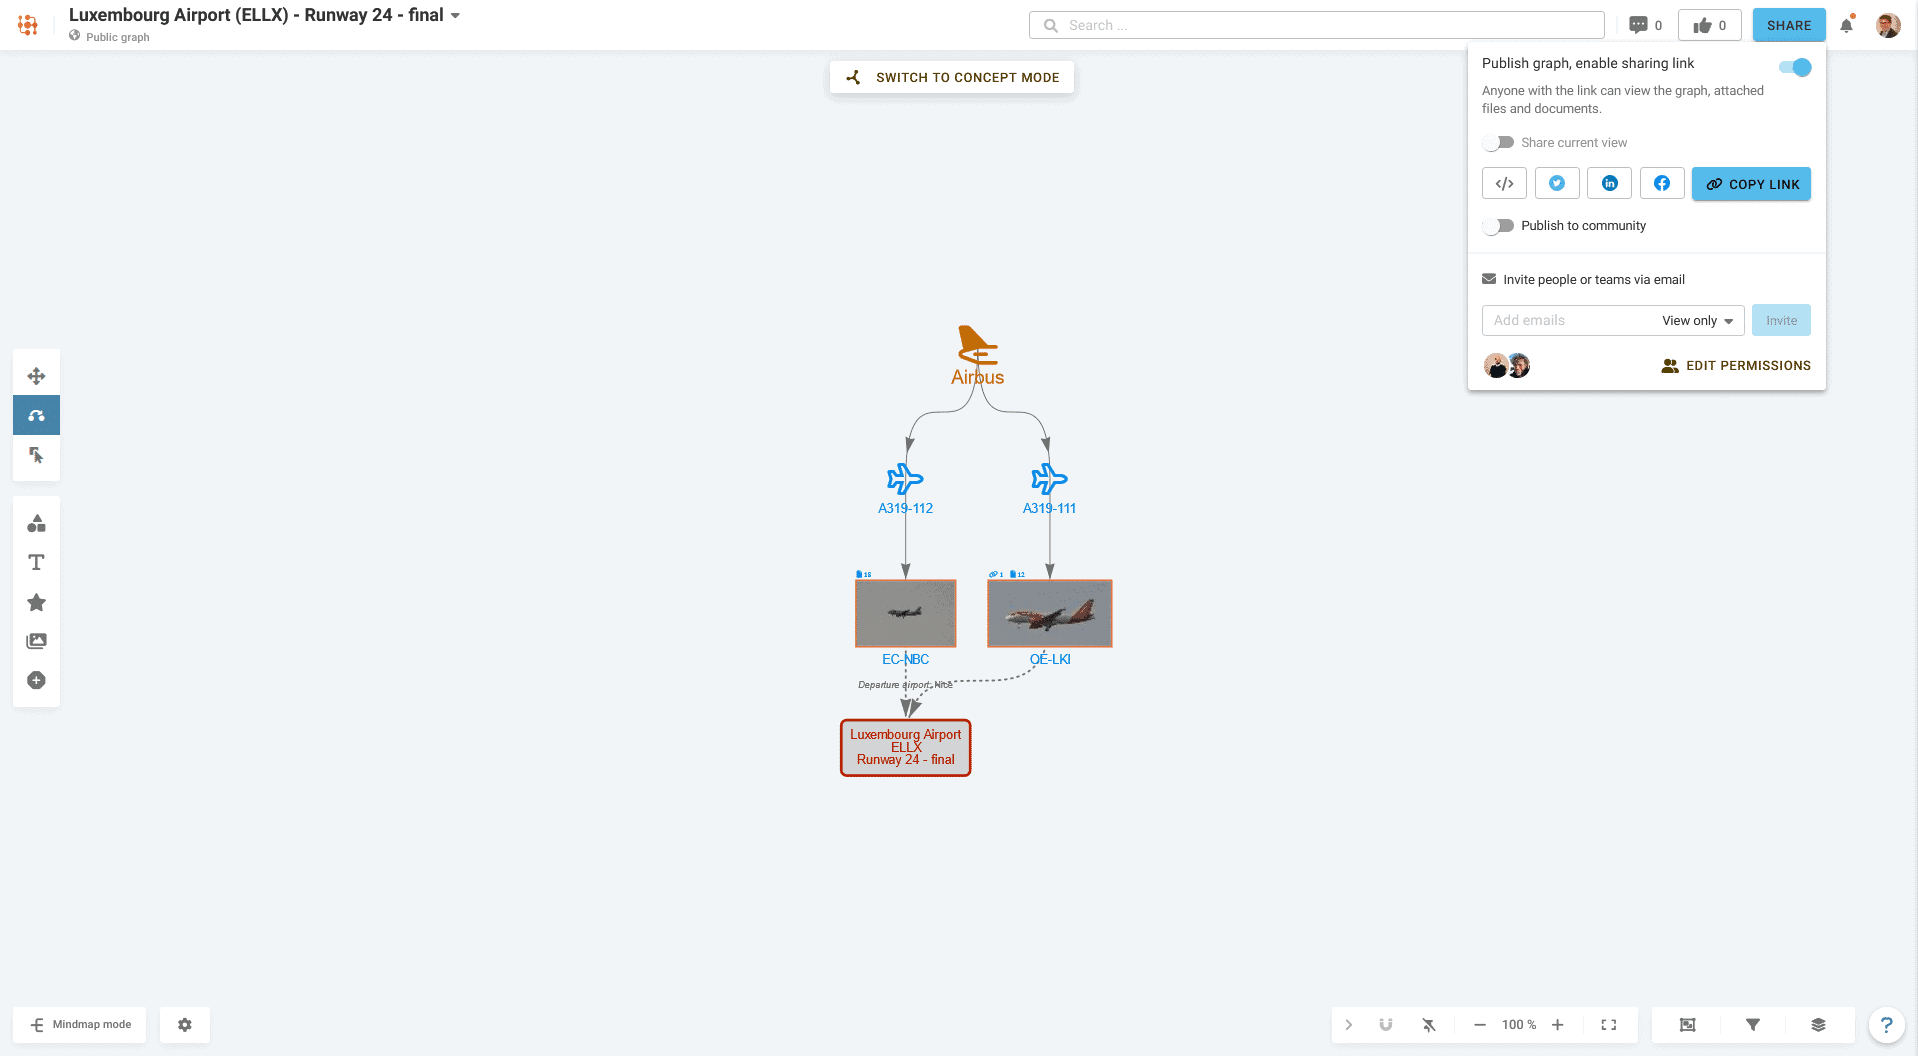
When sharing, the user can either share the full graph in concept mode, or any part of it in any desired mode. The same works for embedding the full graph or a part into your own website.
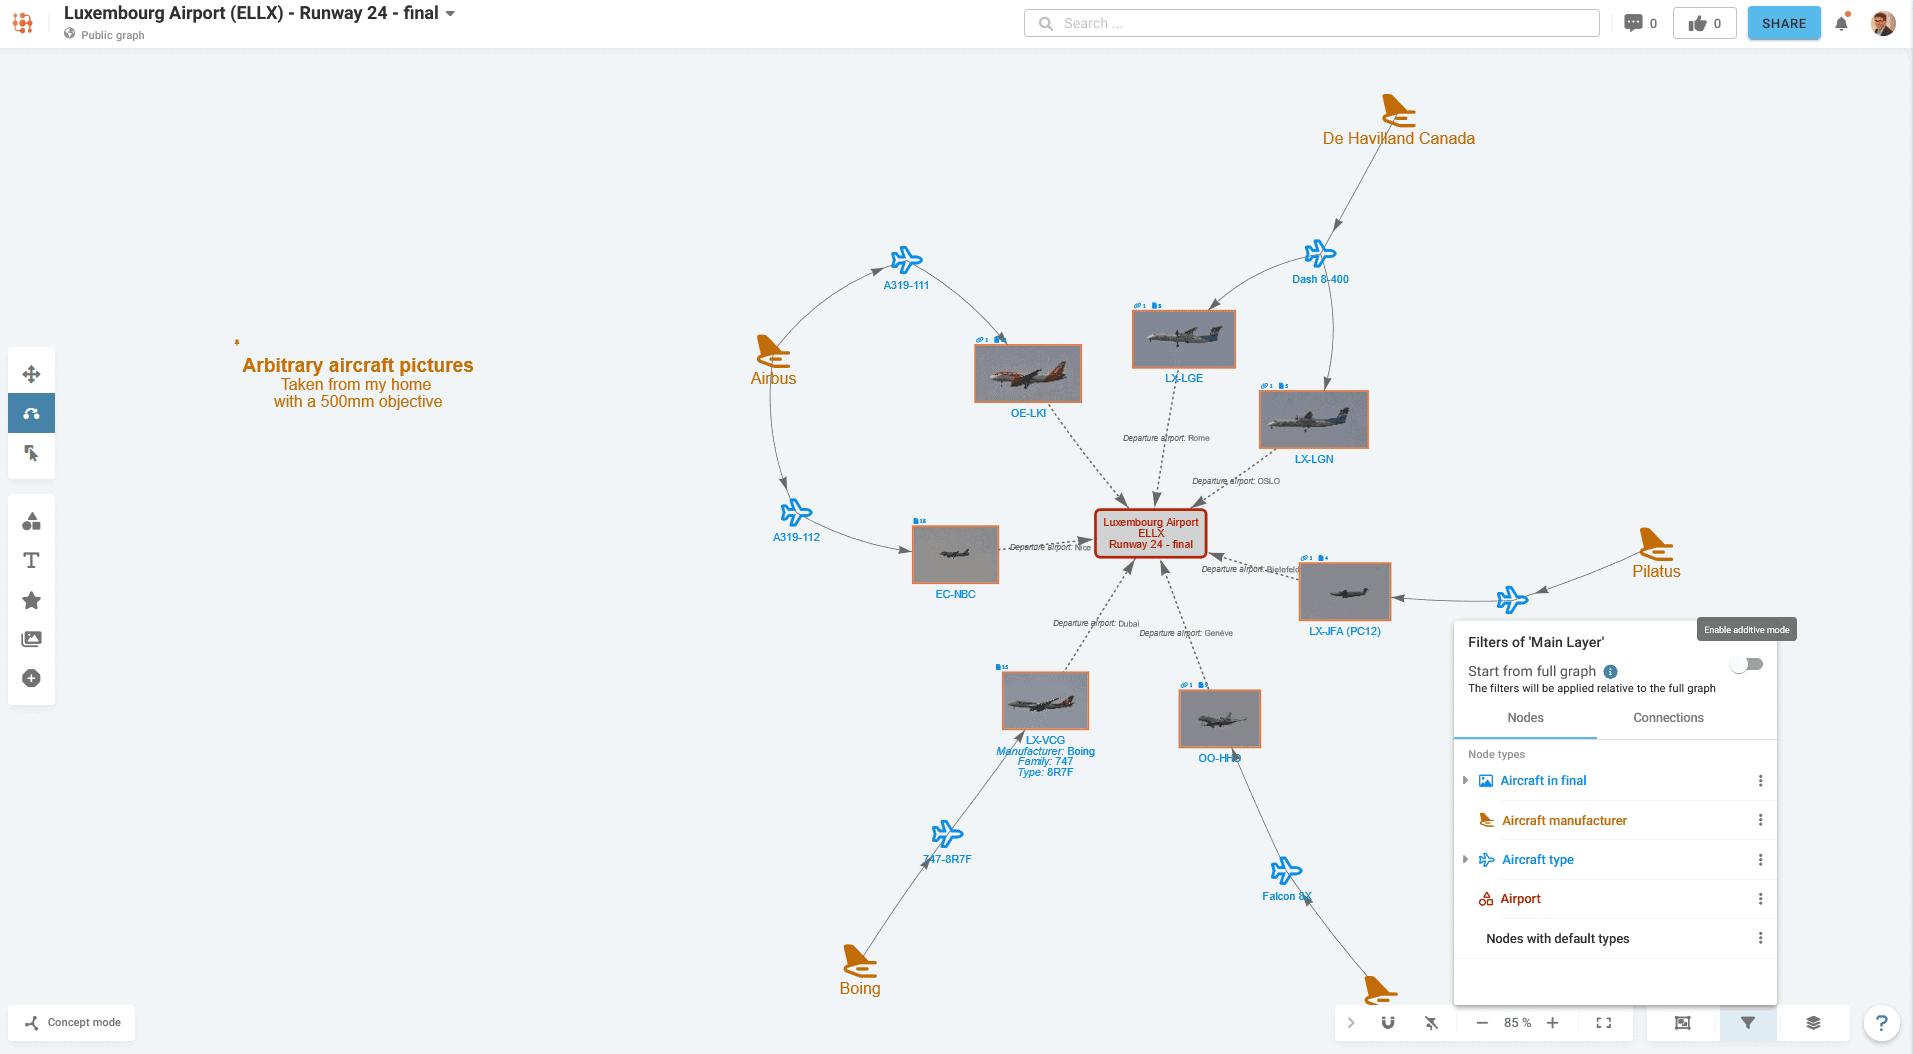
“Show me only the nodes of node types ‘Persons’ and ‘Organizations’ and hide all the rest” or “Show me all but grey-out the completed tasks and projects”. The semantic filters that can both work from the empty graph and add to it (show/grey-out/highlight), or from the full graph and hide/grey-out/highlight from it, gives the user the flexibility he needs to build different filters for different use cases and audiences, and store them as ‘Layers’.
Security and data protection is key for any corporate applications. LinkFacts is no different and organizations can now have their own dedicated and protected data store, have a dedicated instance or an entire on-premise setup, where full control of the security perimeter is in the hands of the organization. Integration with the corporate IT environment via REST-API avoids the double capture inconsistency pitfall.
For an in-depth demo of these new features reserve your seat in our online webinar!