
User’s Guide to Digital History Ressources Map
The Linkfacts Digital History Resources map is an interactive tool to help history buffs, researchers, students, and teachers find the right online sources for their needs. It covers history right from ancient times to the present day, and has a global scope. Whether you are searching for a database, an online journal, a digital archive, or virtual exhibit, there are a range of primary and secondary sources for you to discover.
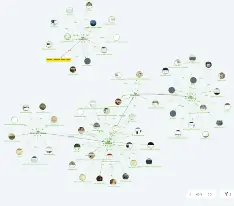
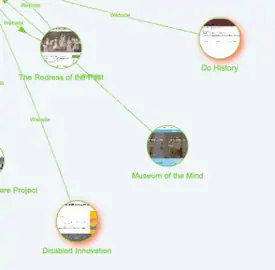
Each resource is symbolised by a ‘node’ – that’s the little circle with a preview of the website inside of it. Most of these are (fully or partially) open access, meaning you don’t need any special permissions to view their content. The nodes are sorted into three categories:
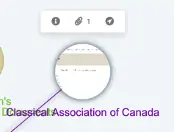
You can click on a node to find out more information about the resource. Clicking on the ‘i’ icon will open up a box containing more details, including a short description and a geographical focus.
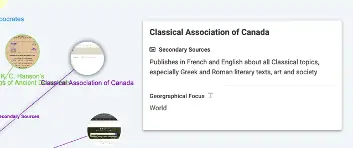
Geographical Focus indicates the location most of the sources in the website refer to. This can be specific (such as Britain or Mexico), or broad (like the Americas, or the World). So far, the areas covered by the resources in this map are:
The above lists will be useful to reference if you would like to filter the map by geographic focus. The geographical focus is given at the broadest level that makes sense for the source. For example, if a website includes information about British history, it will be labelled Britain. However, if it only includes information on Scotland, it will be labelled Scotland. And if it contains information on Britain alongside other European countries, it will be labelled Europe.
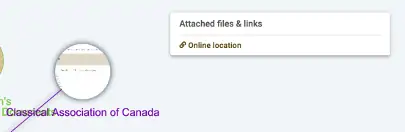
Every node contains a hyperlink to the online location of that source. Click on the circle you want to look at, then click the paperclip icon that pops up. When you click the ‘online resource’ label, the website will open in a new tab so you don’t lose your place on the Linkfacts Map.

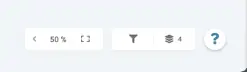
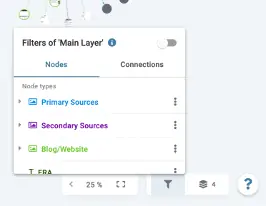
If the whole map is overwhelming to look at all at once, or you just want to be able to quickly find what you are looking for, there are also layers. At the bottom right hand side of your screen, there is an icon of stacked pieces of paper. Clicking on it will open up some preset layers. You can click on each layer which only contains one type of node.
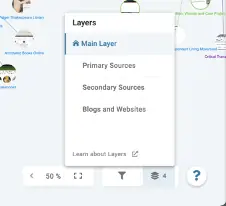
For example, clicking the layer labelled ‘Blogs and Websites’ will hide the primary source and secondary source nodes so you are just looking at the Blog and Website resources.
If you want to filter which nodes are shown by other criteria, you can also do that. Just click on the funnel icon and you can show or hide different node types and connection types.
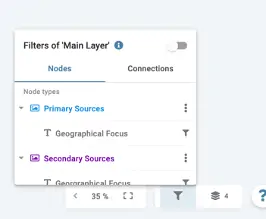
If you want to hone in on resources that have a specific geographic focus, you can also filter for that.
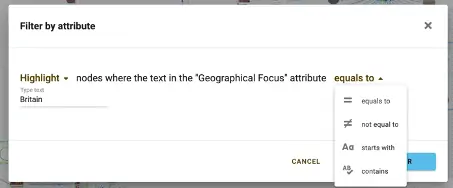
Click the small arrow to the left of the node type you want to filter. Then, click ‘Geographical Focus’ to open the options for filtering.
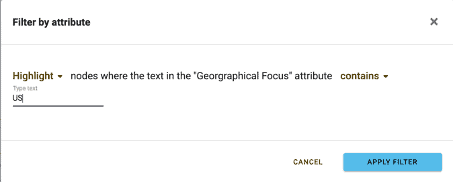
Here, you can choose to ‘highlight’, ‘grey out’, or ‘hide’ nodes which relate to a specific geographic location.
So, if you want to find resources on US History, you can ‘highlight’ any nodes where the geographical focus ‘contains’ the text ‘US’.
This will show give the nodes which focus on US History a red glow so that they stand out and are easy to identify.
On the other hand, if you only want to see resources which aren’t about the US, you can change ‘highlight’ to ‘hide’ (which means US History resources won’t be visible on the graph)or ‘grey out’ (which will colour US History resources in grey so they are less prominent compared to other nodes).
For this graph I suggest filtering by using ‘contains’ rather than ‘equals to’, ‘not equals to’ or ‘starts with’, since some nodes have multiple geographical focuses.
Click on the graph to view and navigate on it one.linkfacts.link
What is your topic of interest?
Try LinkFacts for free and start exploring and organising your ideas.